


Uncertainty Quantification and Propagation for Alloys using the Cluster Expansion
- Mar 17, 2017
- 2 min read
What confidence can we have in alloy property calculations when we use surrogate models? In this project, we develop a Bayesian UQ framework to quantify and propagate the uncertainty when using the Cluster Expansion model.

Introduction
New technological advances require materials with certain properties that may not be found in known material systems. Alloys, combinations of two or more elements in a regular lattice, attractive in this respect due to the ability to tune their properties of interest, and applications in different fields have used them to look for desired electronic, optoelectronic, thermoelectric or elastic properties, to name a few.
Unfortunately, this search is not easy as the number of possible alloys grows exponentially with the number of atoms in the system and most implementations of accurate purely quantum mechanical simulations of solids become too expensive as the system size grows. The use of surrogate models appears as the most feasible way for the explorations of the configurational space of alloys. However, as they approximate more complex models, there is loss in information and therefore uncertainty in their predictions. Traditional surrogate models only provide a value for the function they try to approximate, without a measure of the uncertainty in the predictions. In this project we address this problem by developing probabilistic surrogate models for atomistic simulations which provide not only a value for the approximation, but also a confidence interval which gives an idea of how accurate the particular prediction is.
Methodology
The Cluster Expansion
In the field of alloy modeling, the most important surrogate model is the cluster expansion (CE), which is exact if all of its terms are included.

Figure 1 ECI of the cluster for MgLi. Black dots represent the posterior mean for each of the coefficients and the red error bars the 95% confidence interval.

Figure 2 Formation energies of MgLi with 95% CI. The probability distribution for the predicted structure in the GSL is shown for a set of concentrations. The red bar is the one that belongs to the training GSL at each of the concentrations.

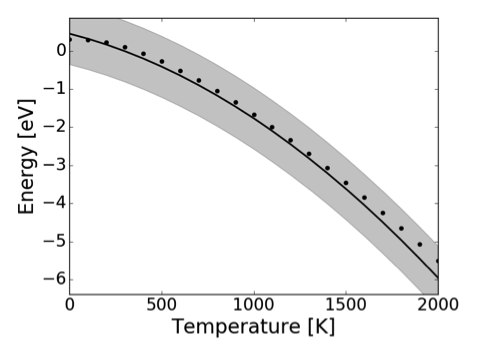

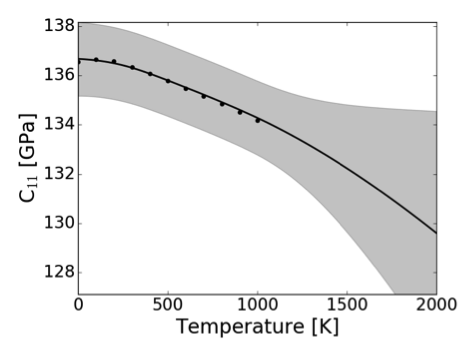
Figure 3 Temperature dependent formation energy (left) and C11 elastic constant for a SiGe configuration. Dots represent test data and the continuous line and shaded region the average prediction and CI.
Figure 4 Probabilistic phase diagram for CuAu. The color represents the probability of having a phase boundary at a particular Temperature/concentration point. The solid black lines show two different realization of the phase diagram.


Comments